Sample Details Summary
Report Summary
The Report Summary page highlights the most interesting information from the sample analysis report. It contains several sections with links to more detailed information. Some parts of the page (e.g. threat name, file format, etc.) are clickable links that, when clicked, automatically perform search queries.
The information on the Summary page will be different for every sample analyzed on the appliance, depending on the file type and classification status.
For more information on interpreting the Sample Summary page, see Interpreting analysis results.
Report Summary Header
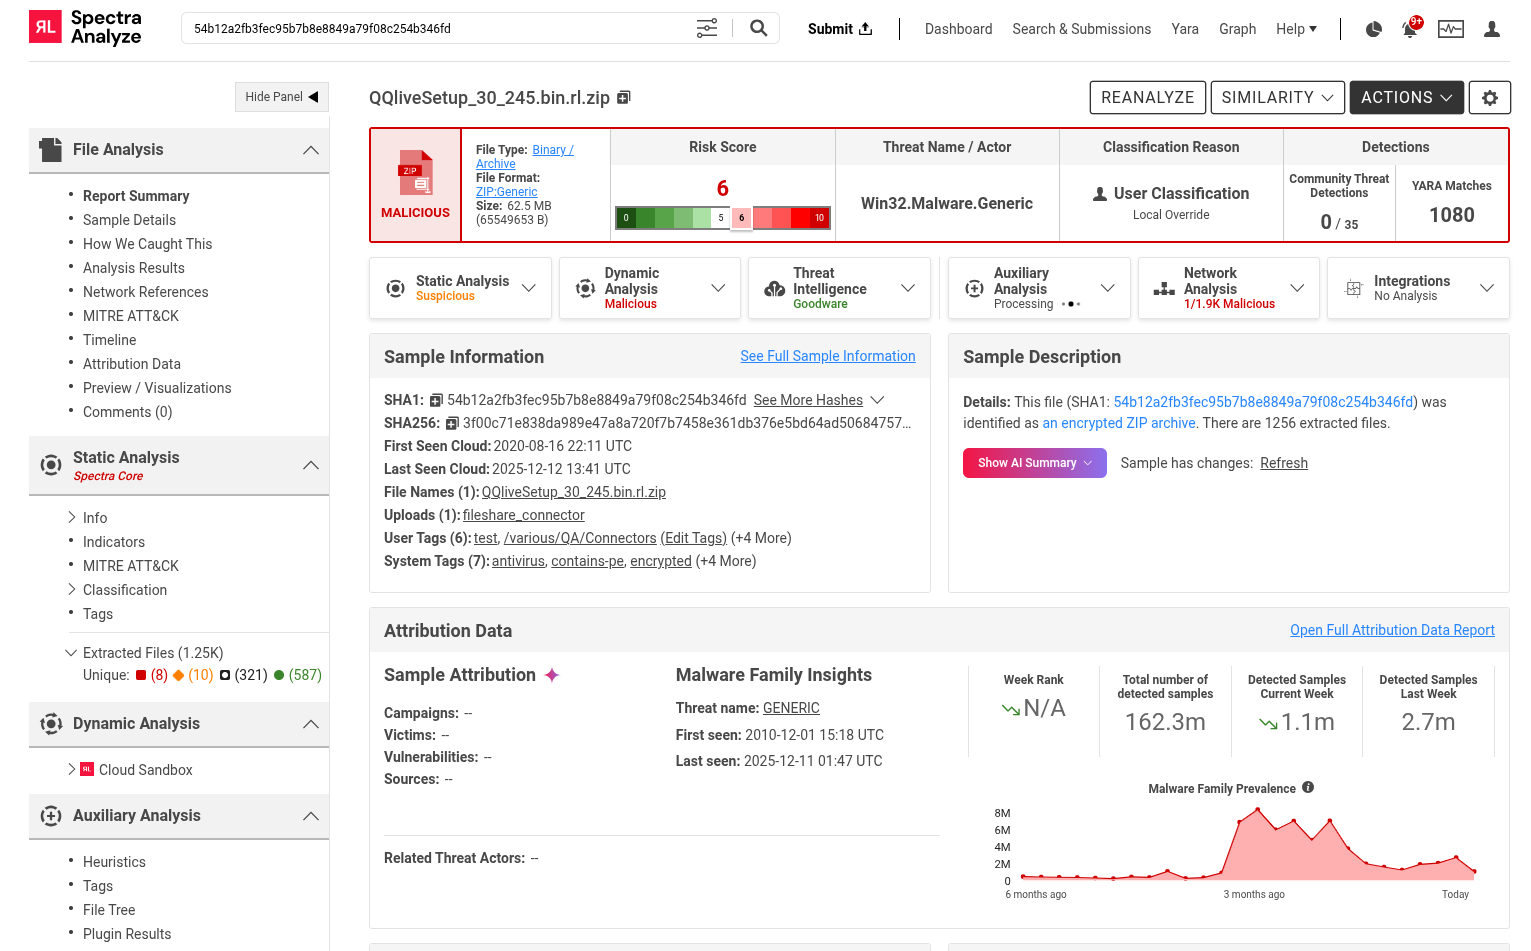
The sample summary landing page starts with a header section. It is colored according to the sample’s classification, and it contains the most important information about the analyzed file.
Risk score and threat name
These tiles show the final classification of the sample. If a sample is goodware, its risk score will be in the 0 - 5 range. For suspicious and malicious files, the risk score will be in the 6 - 10 range. Risk scores depend on the severity of the threat. Read about the ReversingLabs classification algorithm and risk score.
Threat names follow our malware naming standard. Clicking the name scrolls the page down to the Threat Intelligence block with detailed info on the Threat family and actor and links to advanced search and external articles. If the threat is associated with a specific actor, that actor is displayed below the threat name.
Classification Reason
The ReversingLabs classification algorithm uses a number of techniques and classifiers to detect threats. This tile shows the classifier that caused the final classification of the sample. More information about classification reasons can be found in the Threat Classification Descriptions section.
The list of classification reasons can be expanded by enabling the Risk Tolerance preview feature. When Risk Tolerance is enabled, a header indicator will display "Risk Tolerance: Low" to inform users when classification results are influenced by Risk Tolerance.
Detections
Shows the number of Community Threat Detections and YARA matches for the sample. Click the tiles for more information.
Community Threat Detections
The number of community threat detections for this sample.
YARA Matches
The number of YARA rulesets that matched this sample. Visit the YARA chapter for more information on using YARA for threat hunting on Spectra Analyze.
Below the header, the page displays a list of available or configurable analysis methods for the sample. Methods can be clicked to open a menu with more details or analysis options.
The method responsible for the sample's classification is highlighted in the final classification color and labeled as (decisive). Not all analysis methods can be decisive for the final sample classification. These are indicated by a (i) tooltip icon saying "Does not impact final classification."
Analysis methods that are configured but not yet performed display an Analyze button, while unconfigured methods offer a link to their configuration page.
Customizing the Report Summary page
The remainder of the report summary page contains data blocks. Each data block contains a shortened report for a specific subject, such as sample attribution and threat intelligence, relationship graphs, or static analysis insights. The layout of data blocks is configurable.
When you hover over the title of a data block, a short explanation is presented in the tooltip.
Sample Details
The Sample Details report section is broken into multiple tabs containing more information about the sample. Tab sections containing a large amount of entries will be paginated, and can be navigated using the arrow buttons in the top right corner of the section.
Sample Details (tab)
Tags and Uploads - lists a sample’s System and User Tags. Clicking the Add link opens a dialog where it is possible to add tags to the sample. Each tag is clickable and, when clicked, automatically performs a search query for samples based on the selected tag.
Capabilities are displayed as a horizontal bar with icons, but only for supported file formats.
The same information can be found in the Static Analysis > FileType > Capabilities section.
Hash values for the sample. Hovering over any of the hashes displays a button to copy the hash to clipboard.
SHA1 and SHA256 are shown by default, and the section can be expanded to show the remaining hashes (MD5, IMPHASH, SHA512, SSDEEP, TLSH). Hovering over hash values displays a tooltip button that can be clicked to copy the hash to the clipboard.
Malware Description / Sample Description shows a short textual summary (“Storyteller”) that describes the sample’s properties in a user-friendly language. The Storyteller can contain links provided by Spectra Core. Each link leads to the Search & Submissions page, automatically performing a search query for samples based on the selected IOC. Links are also part of the exported PDF report (except those leading outside of the Spectra Analyze instance).
Show AI Summary button provides an LLM-generated overview covering the sample’s behavior, classification, and an executive summary. This feature is disabled by default. Contact ReversingLabs Support to enable it.
In addition to the Storyteller, this section contains the same malware family/type description from the Threat Intelligence Cards on the Advanced Search results page. Clicking the See Full Details link in the section header opens the Advanced Search results page for the sample’s threat name.
If a sample is not malware, this section is titled Sample Description, and does not contain threat intelligence information about malware type or family. Storyteller text is present in all cases.
Comments
This section displays comments that have been added to a sample, either by the user who uploaded it or by other users. The appliance can also automatically add comments to a sample; for example, when a user manually changes its classification.
How We Caught This
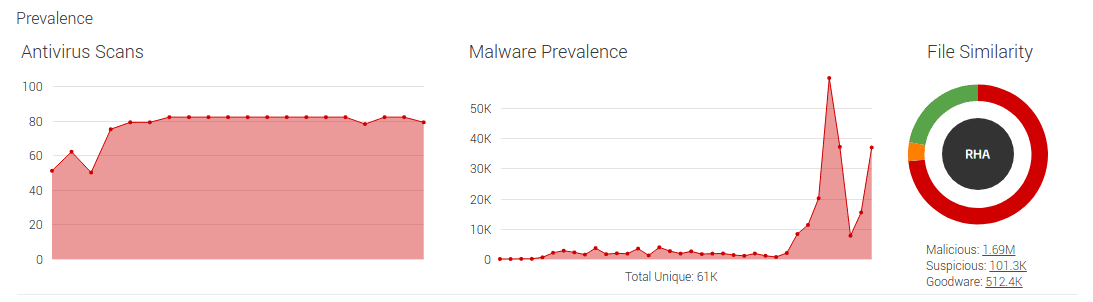
Prevalence
The graphs in the Prevalence section track the history of malware detections for the sample. The first graph, Threat Reputation Scans, shows the percentage of Threat Reputation scanners that have detected the malware over time. The Malware Prevalence graph shows how many overall samples have been detected as belonging to the malware family over the last N months, with the total number of unique samples shown underneath it. Hovering over the dots in the graph displays the exact dates and the amount of detections for each date. The Total amount displayed below the graph refers to the current month.
The Uploads list shows the users who have uploaded the sample, and the number of times the sample has been uploaded. Clicking the number redirects to a search results page with all upload records of this particular sample.
The next part of the Summary page contains information about malware prevalence and the results of the RHA File Similarity (RHA File Similarity) analysis, extracted files and the timeline.
File classifications - displayed for samples that have been classified as suspicious or malicious. The Threat Name information indicates which threat names and classification statuses the sample has received from which classifier. The File information indicates the files within the sample that have been classified with each status and threat name. Clicking a link under File opens the Sample Details page for the selected file.
Extracted Files
The Extracted Files section displays the information about the number and type of file(s) extracted from the sample. If a sample has no extracted files, this section is not displayed at all. If there have been issues while extracting the file, this is indicated by “Failed” and “Partial” status labels on the right side.
Additional sections
Additional sections may be present on the Summary page depending on the metadata extracted from the sample during analysis:
- Files with indicators
- Files with signatures
- Files with descriptions
- YARA matches - displayed if the sample matches any of the YARA rules on the appliance.
- Network references - samples analyzed by dynamic analysis services can have a Network connections section. Clicking any link in the File column redirects to the Interesting strings section of the file associated with that network reference.

- Embedded scripts - offers quick access to the contents of scripts found in the sample. The “eye” icon next to each script opens the floating File Preview dialog. Clicking any of the links (embedded script names) in the File column opens the Sample Details page for that script.

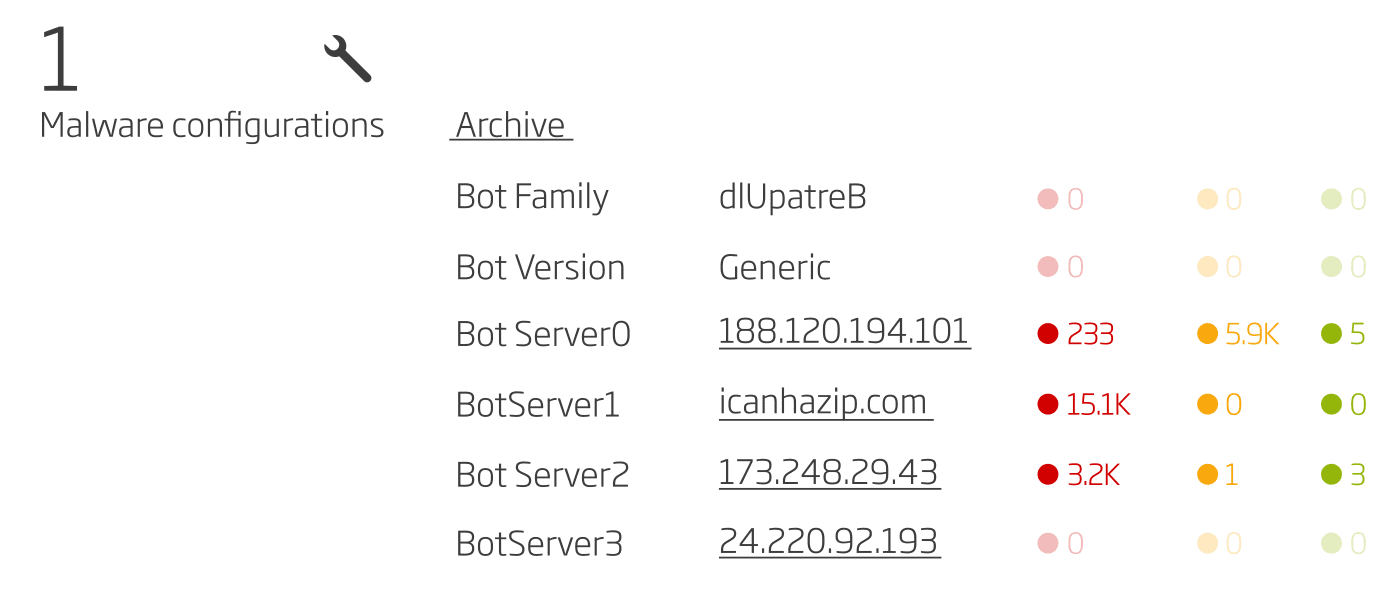
- Malware configurations - samples with detected malware configurations will have a section with URI stats. Clicking any of the URIs opens the search results page for that URI.
Analysis Results
ReversingLabs Analysis is a collapsible table showing an overview of sample processing activities and results.
The table records and displays the last time when the sample was (re)analyzed by ReversingLabs services - Static Analysis (Spectra Core), Threat Intelligence (Spectra Intelligence) and the ReversingLabs Cloud Sandbox (dynamic analysis).
The method that resulted in the final classification of the sample will be highlighted in the appropriate classification color and marked as the Decisive Classification Reason.
This table is collapsed by default, unless processing is still taking place, the sample is missing Spectra Intelligence results, or there is a special point of interest like the sample classification coming from a Local / Spectra Intelligence user override, an extracted file or from goodware overrides.
When applicable, these special/additional classification reasons will be highlighted in a colored bar at the top of the table.
Depending on the current status of the sample and the last analysis time, the table will offer useful suggestions, indicators and possible error messages. For example, it will display a message if Spectra Core was updated to a newer version since the last analysis, if the sample might have outdated Spectra Intelligence classification data, or if the file type is not supported by the Cloud Sandbox.
The far right of the column contains context-dependent buttons for reanalyzing the sample, uploading it to the cloud, or accessing the Spectra Intelligence configuration page. Sample classification can be manually changed by clicking the OVERRIDE button in the top right corner of the table. See Setting Custom Classifications for more information.
If the appliance detects a possible discrepancy between the Spectra Core and Spectra Intelligence classification results, it will automatically submit the sample for reanalysis. This functionality is available only when the Enable ReversingLabs File Reputation option is active in Administration ‣ Configuration ‣ Spectra Detect Processing Settings. The classification will not necessarily change after reanalysis.
Keep in mind that samples previously processed by Spectra Intelligence will still retain their analysis result in the table even after Spectra Intelligence configuration is disabled on the appliance
Integrations Analysis is a collapsible table showing an overview of dynamic analysis services and results. Items in this section do not affect the final classification of the sample, but can be useful as additional sources of metadata.
The table records and displays the last time when the sample was (re)analyzed by integrated dynamic analysis services, if any are configured. The far right of each table row contains context-dependent buttons for reanalyzing the sample or, if the service is not configured, accessing the configuration page for the respective service.
Classification Timeline
The Timeline provides a historical overview of activities performed on the sample. It records the dates when the sample was first seen by Spectra Intelligence and on the local appliance, when it was classified by Spectra Core, (re)analyzed by static or dynamic analysis services, and more.
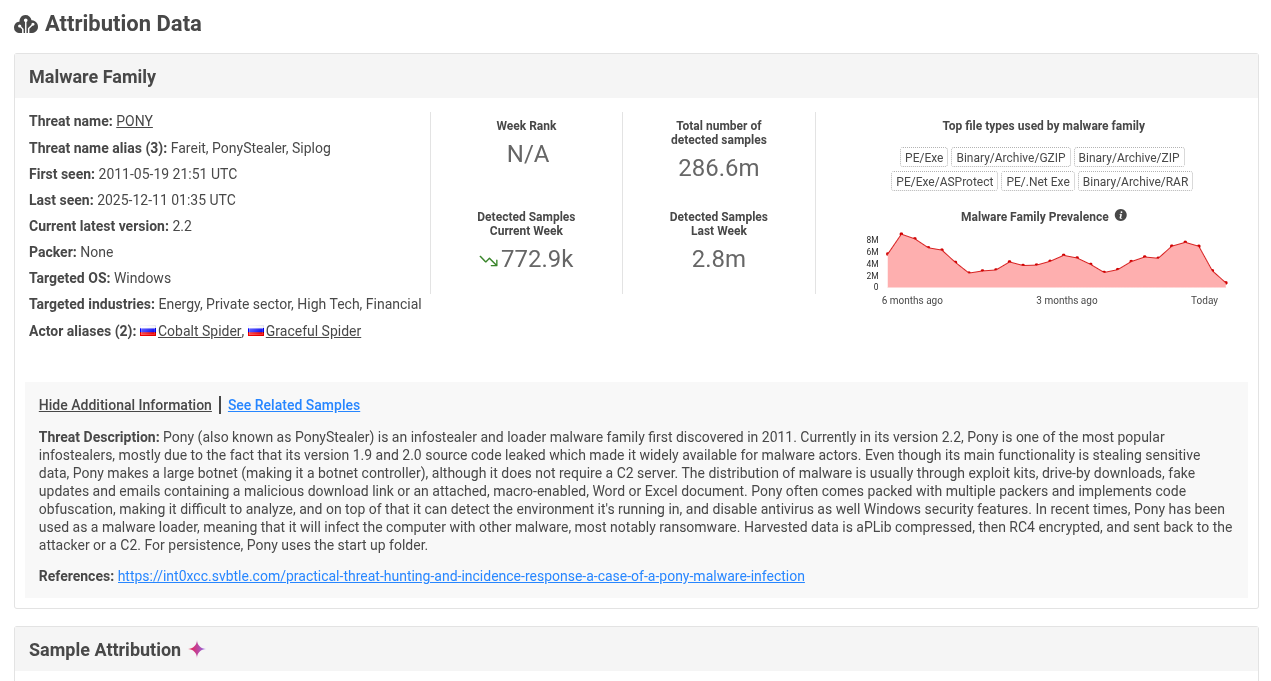
Attribution Data
The Attribution Data page provides comprehensive threat intelligence about the malware family associated with the analyzed sample. This page offers deeper insights into the threat's origins, behavior, and related indicators.
The information on this page is predominantly LLM-generated, indicated by the star icon next to the section title. Review the information for accuracy before relying on it.
The page is organized into several sections:
Malware Family
Core identification details including threat name, aliases, first/last seen dates, current version, packer information, targeted operating systems, and industries.
Detection Statistics - Weekly ranking, total detected samples, and week-over-week detection trends. Top File Types - Distribution of file formats commonly used by the malware family (e.g., PE executables, DLLs, archives, Office documents). Malware Family Prevalence - timeline graph showing detection activity over the past six months. Threat Description - A detailed narrative explaining the malware's history, capabilities, infection vectors, persistence mechanisms, and communication protocols. References - External sources and research publications for further reading.
Sample Attribution
This LLM-generated section maps the sample to known threat actors and campaigns:
Actor Name - The threat actor or group attributed to the malware. Campaigns - Known malicious campaigns associated with the sample. Victims - Targeted entities or sectors. Vulnerabilities - CVEs or weaknesses exploited by the malware. Sources - Intelligence sources supporting the attribution.
Actor Insights
- Actor description and operational history
- Aliases used across different threat intelligence vendors
- Country of origin (if known)
- Group type (e.g., cybercrime group, APT)
- Known tactics employed by the actor
Actor Related IOCs
A table listing indicators of compromise (IOCs) linked to the actor, including IP addresses, domains, and other artifacts. Each entry shows the indicator name and its type.
Actor Related Campaigns
A table of campaigns attributed to the actor. Each campaign can be expanded to reveal additional details:
- Date - When the campaign was active.
- Techniques - Tactics and techniques used during the campaign.
- IOCs - Associated indicators including hashes, URLs, IPs, and domains.
Actor Related TTPs
A table of tactics, techniques, and procedures (TTPs) associated with the actor. Each entry includes:
- Name - The technique or tool identifier.
- Description - How the actor employs the technique.
Related Vulnerabilities
A list of vulnerabilities exploited by the actor. Each entry shows the CVE identifier and a brief description of how it was used.
Referenced Actors
Connections to other threat groups.
Sources
Intelligence reports and documentation used to generate the attribution data.
Network References
The network references tab contains all URLs, IP addresses and domains found in relation to the sample. This includes network locations that the file attempted to visit during a dynamic analysis run, IP addresses found inside the sample during static analysis, as well as places where the URL was found (sources).
MITRE ATT&CK
MITRE ATT&CK is a section mapping indicators detected by Spectra Core to MITRE threat IDs. This section can be displayed for all samples regardless of their classification status (malicious / suspicious / known / no threats found), as long as they have indicators that can be appropriately mapped to the ATT&CK framework. Samples without indicators will not have this section on their Sample Details page at all.
The section lists MITRE tactics in the table header. MITRE techniques are grouped under each tactic. Every technique can be clicked to show Spectra Core indicators mapped to it (which can then be clicked to run an Advanced Search for samples with those same indicators). The table can be further filtered to show all techniques or just the detected ones, and technique IDs can be either displayed or hidden.